Първоначално изпратено от r22
Разгледай мнение
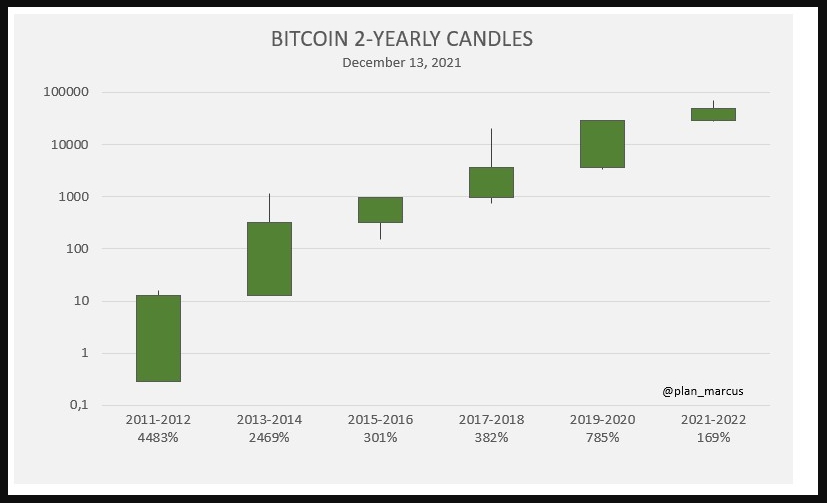
Ти заговори за графики. Подсказка. Намери графика на себстойността на Биткойн. Приблизително, естествено. Ток, машинки. Труд, амортизация, наем.
И я наложи, върху търговска графика.

")


Коментар